AI在医学中的应用逐渐广泛,做一名优秀的跨学科医生需要能读懂AI相关的英文文献,其中的专业用语就非常重要,在此我们开设一个新的专题,介绍AI相关的医学英语。本期将继续介绍机器学习基本流程中特别需要注意的地方。红字单词或短语为了解,划线单词或短语作为识记。
Fundamentals of Machine Learning and Deep Learning in Medicine
Reza Borhani, Soheila Borhani, Aggelos K. Katsaggelos
第一章 初步介绍
Chapter 1 Introduction
●主译 Izzy ●数学顾问 LXC ●审校 Reed
(花哩医学考博专业英语团队原创,禁止转载)
第二节 深入挖掘机器学习流程
A Deeper Dive into the Machine Learning Pipeline
3.重新复习模型训练 Revisiting Model Training
如前所述,在“机器学习流程”一节中,线性分类器的训练可以归纳成这样的过程:找到一条直线,将特征空间划分为两个区域,每类数据在一个区域。现在,我们将更详细地讨论如何来寻找这条直线。As discussed previously in Sect.“The Machine Learning Pipeline”, training of a linear classifier boils down to归结为 finding a line that divides the feature space into two regions: one region per each class of data. Here we discuss what the process of finding this line actually entails需要,使必要 in greater detail.二维空间中的任何直线都可以由三个参数来表示:两个斜率参数用来衡量直线在各维度上的方向,一个偏倚或偏移参数。用x1和x2表示两个维度,用w1和w2表示相应的斜率参数,用w0表示偏倚参数,这个直线的数学表达式可以写成w0 + w1x1 + w2x2 = 0. (1.1)
Any line in a two-dimensional space can be characterized by three parameters参数: two slope斜率 parameters measuring the line’s orientation in each dimension, as well as a bias or offset补偿,抵消,偏离量 parameter. Denoting表示 the two dimensions by x1 and x2, the corresponding slope parameters by w1 and w2, and the bias parameter by w0, the equation方程,等式 of a line can be written formally asw0 + w1x1 + w2x2 = 0. (1.1)
例如,设w0=0、w1=1和w2=−1,可得一条方程为x1−x2=0的直线,该直线穿过原点,与水平轴和垂直轴均成45°。在w0、w1和w2所有可能的值中,我们寻找一组值,使得到的直线能最好地归类两类数据。更准确地说,我们希望设置一组直线参数,以最大限度地减少分类器产生的分类错误。用数学来表示的话,我们可以设一个函数g(w0, w1, w2),该函数的输入值是一组特定的直线参数,返回的输出值为分类器w0 + w1x1 + w2x2 = 0所产生的分类错误的数量。图1.10中,我们展示了玩具分类数据集(译者注:玩具数据集通常用来指一些可用来学习算法的经典小规模数据集)中,(w0, w1, w2)的三组设置,可以得到三个不同的分类器和三个不同的g值。For example, setting w0 = 0, w1 = 1, and w2 = −1 results in a line with the equation x1 − x2 = 0, which goes through the origin原点 while forming a 45° angle with both the horizontal and vertical axes. Of all possible values for w0, w1, and w2, we look for those resulting in a line that separates the two classes of data as best as possible. More precisely精确地, we want to set the line parameters so as to目的是,为了 minimize the number of errors or misclassifications made by the classifier. We can express this idea mathematically by denoting by g(w0, w1, w2) a function函数 that takes a particular set of line parameters as input and returns as output the number of classification errors made by the classifier w0 + w1x1 + w2x2 = 0. In Fig. 1.10, we show three different settings of (w0, w1, w2) for a toy classification dataset, resulting in three distinct不同的 classifiers and three different values of g. 图1.10 (图一)玩具分类数据集的特征空间由两类数据组成:蓝色正方形和黄色圆形。(图二)参数(w0, w1, w2) = (16,1,-8)定义的直线对三个黄色圆圈的分类不正确,因此g(16, l, -8) = 3。(图三)参数(w0, w1, w2) = (4,5,-8)定义的直线将一个黄色圆圈和一个蓝色正方形错误分类,因此g(4, 5, -8)=2。(图四)参数(w0, w1, w2) = (-8,1,4)定义的直线仅对单个蓝色正方形进行了错误分类,因此g(-8,1,4) = 1
Fig. 1.10 (First panel) The feature space representation of a toy classification dataset consisting of包括 two classes of data: blue squares and yellow circles. (Second panel) The line defined by the parameters (w0, w1, w2) = (16, 1, -8) classifies three yellow circles incorrectly, hence因此 g(16, 1, -8) = 3. (Third panel) The line defined by the parameters (w0, w1, w2) = (4, 5, -8) misclassifies one yellow circle and one blue square, hence g(4, 5, -8) = 2. (Fourth panel) The line defined by the parameters (w0, w1, w2)= (-8,1,4) classifies only a single blue square incorrectly, hence g(-8, 1, 4) = 1
函数g在机器学习术语中通常被称为损失函数或误差函数。我们的目标是通过找到w0、w1和w2的最优值来最小化该函数,这个最优值分别用w0*, w1*和w2*,也就是对于w0、w1和w2的所有值均有g(w0*, w1*, w2*) ≤ g(w0, w1, w2) (1.2)
例如,对于图1.10所示的玩具分类数据集,我们得出w0* = −8,w1* = 1,w2* = 4。这意味着g(w0*, w1*, w2*) = 1是最小的损失值,也就是所有线性分类器在该特定数据集上可获得的最小错误数。确定给定损失函数的最佳参数值的过程称为数学优化。The function g is commonly referred to as a cost function or error function in the machine learning terminology术语,术语学. We aim to minimize this function by finding optimal最佳的 values for w0, w1, and w2, denoted, respectively, by w0*, w1*, and w2*, such thatg(w0*, w1*, w2) ≤ g(w0, w1, w2) (1.2)
for all values of w0, w1, and w2. For example, for the toy classification dataset shown in Fig. 1.10, we have that w0* = −8, w1* = 1, and w2* = 4. This corresponds to相当于,对应 a minimum cost value of g(w0*, w1*, w2*) = 1, which is the smallest number of errors attainable可以达到的,可以获得的 by any linear classifier on this particular set of data. The process of determining the optimal parameter values for a given制定的,假定的 cost function is referred to as mathematical optimization最优化.请注意,与图1.4所示的皮肤癌分类数据集不同,图1.10中的玩具数据集不是线性可分的,也就是找不到一个线性模型可以对其进行分类而没有分类错误。这种类型的数据在实践中很常见,需要更复杂的非线性分类模型,如图1.11所示。在该图的第二、第三和第四个小图中,我们分别展示了多项式、决策树和人工神经网络分类器。这是三个最受欢迎的非线性分类模型家族,最后一个是我们在第六、七章中研究的重点。Note that unlike the skin cancer classification dataset shown in Fig. 1.4, the toy dataset in Fig. 1.10 is not linearly separable可分离的,可分隔的, meaning that no linear model can be found to classify it without error. This type of data is commonplace平凡的,不足为奇的,司空见惯的事 in practice and requires more sophisticated复杂的 nonlinear classification models such as the ones shown in Fig. 1.11. In the second, third, and fourth panels of this figure, we show an instance of a polynomial多项式的, decision tree, and artificial neural network classifier, respectively. These are the three most popular families of nonlinear classification models, with the latter family being the focus of our study in Chaps. 6 and 7.
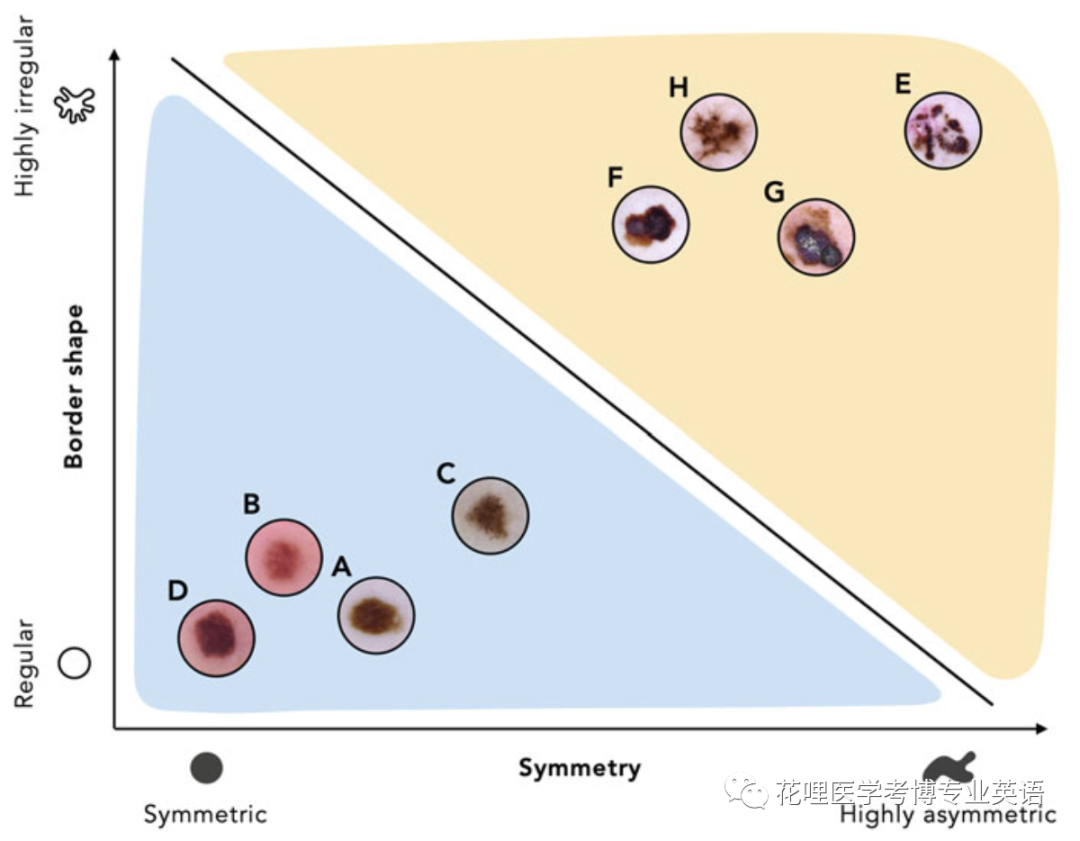
图1.4 模型训练包含了找到一条合适的直线,将特征空间中的两类数据分开。图中线性分类器的黑色直线提供了区分良性和恶性病变的计算规则。如果病变的特征位于直线下方(在蓝色区域),则归类为良性病变,位于其上方(在黄色区域),则归类为恶性病变
图1.11(图一)如原图1.10所示的玩具分类数据集。(图二)多项式分类器。(图三)决策树分类器。(图四)神经网络分类器。这里显示的每个非线性分类器都能够完美地区分两类数据
Fig. 1.11 (First panel) The toy classification dataset shown originally in Fig. 1.10. (Second panel) A polynomial classifier. (Third panel) A decision tree classifier. (Fourth panel) A neural network classifier. Each of the nonlinear classifiers shown here is capable of separating the two classes of data perfectly